[ ]:
Data Manipulation and analysis
Introduction
In the last chapter, we have covered basic programming with Python and showed how computer programming fundamentals can be used to solve complex problems. The number of real life applications of computer programming is so massive that many scientist compare this technological advancement with milestones like agriculture, mechanisation, or the combustion engine. Since the benefits are so vast, our society has been using computers programs and algorithms for an ever-growing number of applications, and they have been so successful solving problems, that they have grown in size and complexity. This growth also means an exponential increase in the volume of data required to run these programs. Indeed, as depicted in the famous 80s movies Short Circuit, applications are hungry for data!
Now that we are back in the 80s, did you know that the icon used besides the save button in numerous applications represents a physical storage format used in the 80s and early 90s?
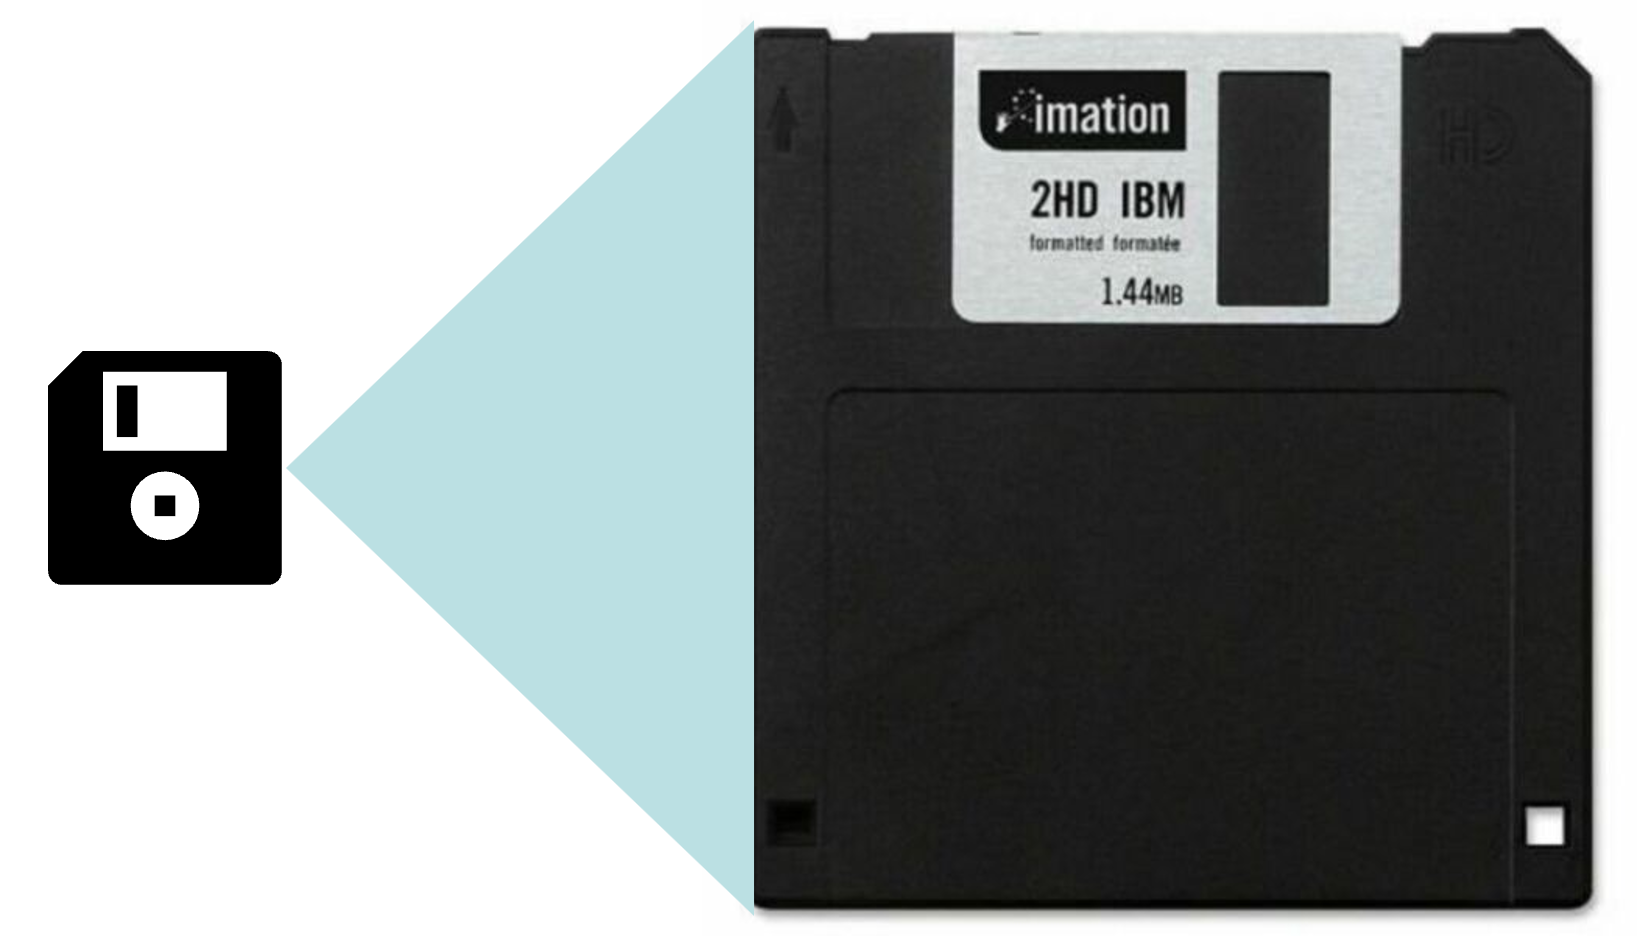
Yes, as shown in the picture, floppy disks were exactly 5.1 inches big and had a storage capacity of 1.44MB. Back in the day, that storage capacity was enough to store relevant data in most applications, but nowadays, it looks very, very small. To see how small it was, the following figure represents the storage capacity of a floppy disk compared to the storage capacity of a 32GB SD card (which is actually not that big, but still enough to hold relevant data)
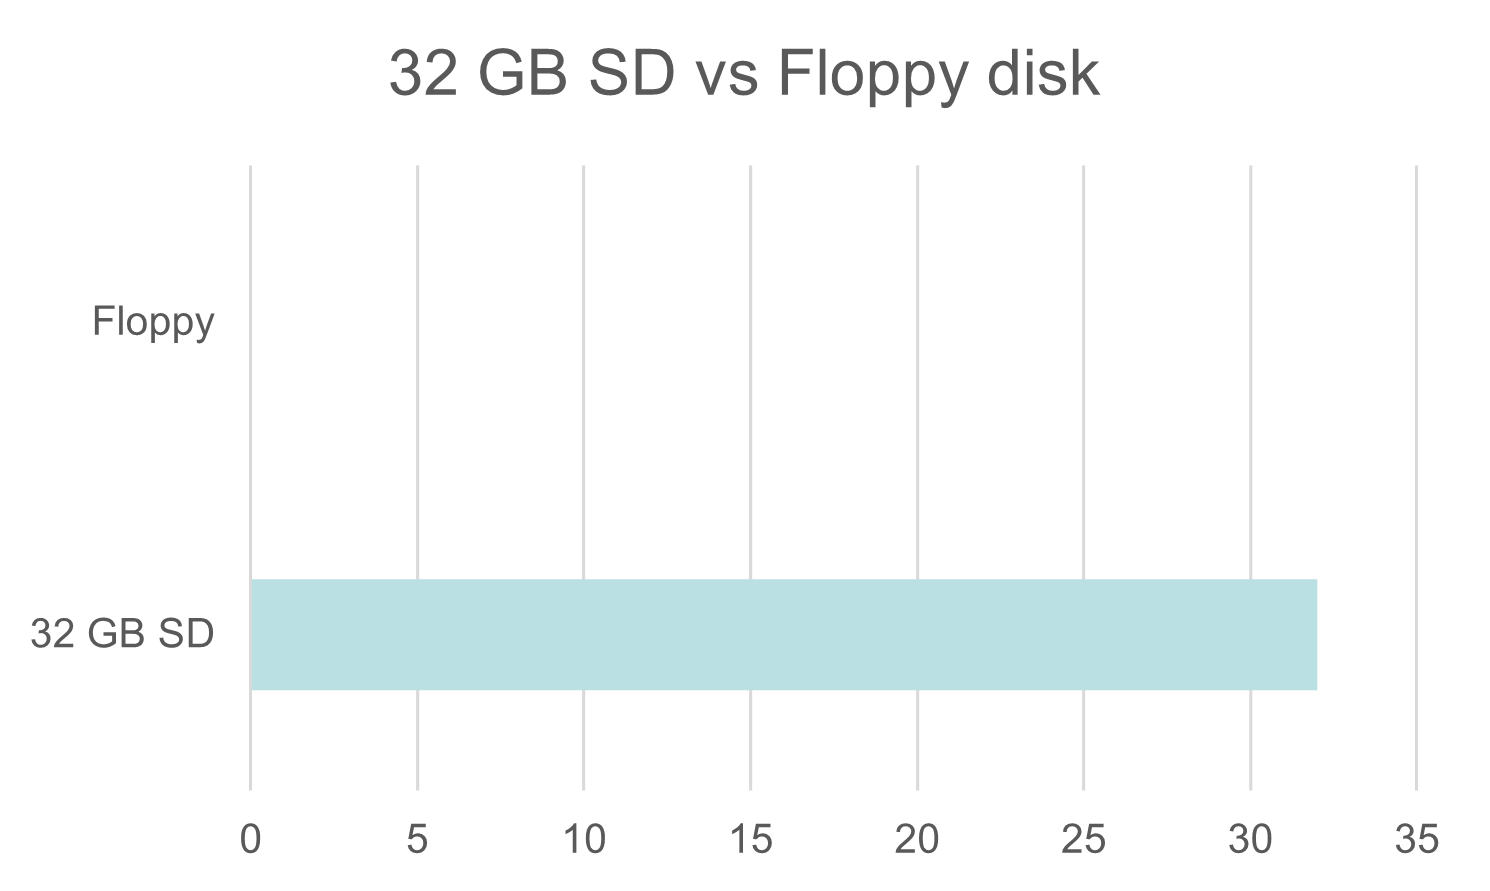
The difference is so massive that it is not possible to represent both units of storage in the same linear scale. We can represent both in logarithmic scale to see how many orders of magnitude exist between both units of storage.

In the figure, we added two dots, one to represent how many times the sun is larger than earth (since, as you know, the sun is way bigger than our home planet) and another one to represent how much bigger is a human compared to an ant (since we normally see the sun from really far away, this analogy might be easier to relate to). You can see that they are in the same order of magnitude! So, in few decades, programs have switched from dealing with data the size of insects 🐛 to data the size of mammals 🫏.
Clearly, data manipulation and analysis has become increasingly relevant in our society, but also increasingly complex. We need efficient tools and processes to deal with data in our processes.
Tabular data
In many applications, data is organised in vectors that build up to rows and columns in matrices. These type of data is called tabular data and is normally stored in formats specifically defined to support its organisation in columns and rows.
You are probably familiar with tables as a means to organize data, and used tools like Google Sheets or Microsoft Excel that have been specifically designed to deal with tabular data.
Normally, in these tables, each column contains data of a property, attribute, or parameter of interest for a particular application. Columns are also sometimes refer to as information fields or just fields. The type of the data contained in each column or field is not necessarily numeric, they can also contain dates, or text.
Since we are establishing the terminology for tabular data, a row is often referred to as a record, and the intersection of a column and row is referred to as a cell, so table cells contain information fields and are organized in two axis, in rows in the vertical axis and in columns in the horizontal axis.
Normally, each row and cell have a unique identifier, or index, that is, a number, text, or alphanumeric code (combination of numbers and letters) that uniquely identify each row or cell. The row index uniquely identifies each row and the column index uniquely identifies each column.
Finally, many tables include a header row: a row that contains the name of each property of interest in the row.
These key concepts are illustrated in the figure below:

Data processing
Clearly, the data that builds up the matrices and vectors used by our applications need to be collected and manipulated to provide meaningful information. This is called data processing. Traditionally, in literature data processing is organised into a three-phase process called Extract, Transformation, and Load (ETL).

Extraction: In many cases, the data we need will be stored in one or several data sources, such as websites, files, or databases. The processing of reading and collecting data from these sources is called extraction.
Transformation: Often, the data might not be in the format required by our application, and we need to apply some transformations to it to adapt it. Some examples (non.exhaustive) of data processing steps in this phase are:
Validation: Make sure that only relevant, valid data is passed to the next phase, ignoring or filtering out unuseful or malformed data entries.
Translation and Encoding: Changing the values of source data to match the expected set of values in our application.
Sorting: Changing the order of data entries (sorting) or divide it into different sets to facilitate later analysis.
Summarization and Aggregation: Reduce redundant data and/or derive statistics like mean values to summarize data and speed up the extraction of meaningful information.
Joining: Combining different sources of information.
Transposing/Pivoting: Re-arranging tabular data, changing rows into columns or vice-versa.
Load: Finally, once that all transformations have been applied, we may load the transformed data into a target file or database in a format more suitable for analysis, and later read this file and load the data into objects in memory to proceed with the representation and analysis of data. This is normally done so that the transformation part does not need to be repeated everytime we analyse data. However, as data processing becomes more fast and efficient, many applications do the transformation and analysis in the same phase.
In the next notebooks we will describe Pandas, a Python library that implements objects and functions to support all these data processing, providing effective means to work with tabular data. But before we dive into Pandas, let´s take a brief overview on how to work with files in Python and review some common file formats for tabular data.