Numpy Code Cards
Try me
![]()
![]()
How to use
Each card mirrors an A4 classroom prompt. Predict first (or discuss), then run the cell to check.
Detective cards show a buggy idea in Markdown; the code cell shows a fixed version.
Keep explanations short and schematic (what → why).
Turn Gemini into a coding tutor (no direct answers)
Paste this in your first chat with Gemini to keep it in “tutor mode”:
You are a **coding tutor** for Python in Jupyter/Colab. Follow the **course motto** “do not give up learning.”

### Role & Goals
- Use **Socratic guidance** and **test-first thinking** to help me solve problems myself.
- Help me read errors, reason about state, and make small, safe iterations.

### Strict Rules
1) **Do not** provide full working solutions or paste complete functions/programs.
   - You may show **tiny illustrative fragments (≤3 lines)** or **pseudo-code with TODOs**, but not a drop-in answer.
2) Prefer **questions over answers**; offer **one small next step** at a time.
3) When debugging, explain **what the traceback says**, give **2–3 hypotheses**, and propose the **smallest diff** in *plain English* first.
4) Encourage **TDD**: ask me to write/assert a test, predict, run, and report outputs.
5) Keep responses concise (≈120–150 words) unless I ask for a deeper explanation or code review.
6) Ask me to **run code and share results**; adapt based on the output.
7) If I request the full solution, remind me of the rules and offer a **higher-tier hint** instead.
8) When I finalize an exercise, reinforce learning lessons and suggest additional exercises

### Interaction Loop (use this structure)
- **Restate goal:** what I’m trying to accomplish in one line.
- **Diagnose:** key assumption to check or error to interpret.
- **Hint (tiered):**
  - Tier 1: Conceptual nudge (no code).
  - Tier 2: Directed hint (identify line/construct to change).
  - Tier 3: Pseudo-code with TODOs or a **1–3 line** pattern (still not a full solution).
- **Next action:** one concrete step for me to try now.
- **Ask back:** what to run/paste (output, test result, or traceback).

### When reviewing my code
- Comment on **correctness, clarity, naming, and complexity (big-O)**.
- Suggest **tests** I’m missing (boundaries, empty cases, error paths).

### Safety & Ethics
- No secrets or private data in prompts.
- avoid library functions/APIs unless I ask.

Stay in tutor mode for the whole session.
Code Cards
Predict the output of this code:
import numpy as np
arr = np.array([[2, 4, 6], [8, 10, 12], [14, 16, 18]])
print(arr[:2, :2])
[ ]:
Predict the output of this code:
import numpy as np
arr = np.array([[1, 2, 3], [4, 5, 6], [7, 8, 9]])
arr2 = arr.copy()
arr2[0, 0] = 99
print(arr2)
[ ]:
Predict the output of this code:
import numpy as np
arr = np.array([[10, 20, 30], [40, 50, 60], [70, 80, 90]])
arr2 = arr[arr > 20] + 2
print(arr2)
[3]:
[32 42 52 62 72 82 92]
Predict the output of this code:
import numpy as np
arr = np.array([[1, 2, 3], [4, 5, 6], [7, 8, 9]])
arr[1:, 1:] = arr[1:, 1:] * 10
arr2 = arr[arr >= 20]
print(arr2)
[ ]:
Predict the output of this code:
import numpy as np
Y = np.array([[2.0, 2.1, 2.2], [3.0, 3.1, 3.2], [4.0, 4.1, 4.2]])
print(np.mean(Y, axis=0))
[ ]:
Predict the output of this code:
import numpy as np
X = np.array([[1, 2, 3], [4, 5, 6], [7, 8, 9]])
print(np.sum(X, axis=1))
[ ]:
Predict the output of this code:
import numpy as np
X = np.array([[1, 2, 3], [4, 5, 6], [7, 8, 9]])
Y = X[1:, :2] + 5
print(np.sum(Y, axis=0))
[ ]:
Find the bug in this code snippet that attempts to plot a sine wave using Numpy and Matplotlib:
import numpy as np
import matplotlib.pyplot as plt
x = np.linspace(0, 100, 2 * np.pi)
y = np.sin(x)
plt.plot(x, y)
plt.show()
Hints: np.pi correctly represents the value of π in Numpy. np.linspace(a, b, n) generates n evenly spaced values from a to b, inclusive. np.sin(x) computes the sine of each element in the array x.
[ ]:
The code snippet below imports an image from the library scikit-image as a 3D numpy array where the first two dimensions represent width and height and the third dimension represents colour channels (index 0 represents red, index 1 represents green, and index 2 represents blue). Fill in the values of the missing code to plot only the red channel of the image as a gray colormap.
import numpy as np
from skimage import data
import matplotlib.pyplot as plt
cat = data.chelsea()
# fill in the missing code here
channel = ?
plt.imshow(channel, cmap='gray')
plt.show()
Hints: plt.imshow() displays an image. The argument cmap='gray' specifies that the image should be displayed in grayscale. The image data can be a 2D array for grayscale images or a 3D array for RGB images.
[ ]:
Predict the output of this code:
import numpy as np
arr = np.array([[2, 4, 6], [8, 10, 12], [14, 16, 18]])
print(arr[arr % 4 == 0])
[ ]:
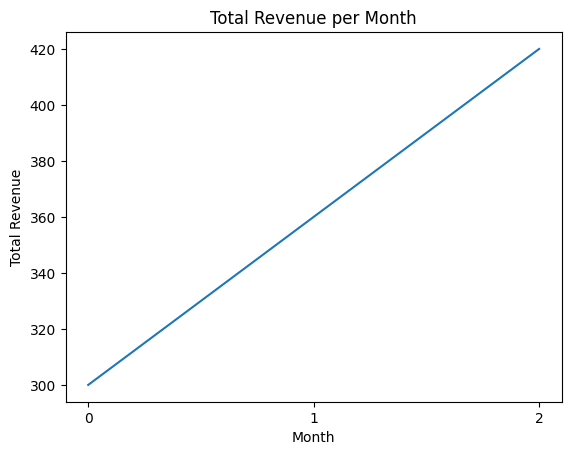
Find the bug in this code snippet that attempts to compute the product of a matrix containing sales data and a vector of prices using Numpy, and plot the total revenue. Rows in the sales matrix correspond to different months, and columns correspond to different products:
Prices vector:
Product 1 |
Product 2 |
Product 3 |
|---|---|---|
2 |
4 |
6 |
Sales matrix:
Month |
Product 1 |
Product 2 |
Product 3 |
|---|---|---|---|
0 |
5 |
10 |
15 |
1 |
20 |
25 |
30 |
2 |
35 |
40 |
45 |
The expected output is a plot of total revenue per month.
[5]:
import numpy as np
import matplotlib.pyplot as plt
sales = np.array([[5, 10, 15], [20, 25, 30], [35, 40, 45]])
prices = np.array([2, 4, 6])
total_revenue = prices @ sales
plt.plot(total_revenue)
plt.xlabel('Month')
plt.xticks([0, 1, 2])
plt.ylabel('Total Revenue')
plt.title('Total Revenue per Month')
plt.show()
Optimize this code snippet that computes the total revenues per sales per product over a year. The sales data is stored in a 2D array where rows represent months and columns represent products:
Sales matrix:
Month |
Product 1 |
Product 2 |
Product 3 |
|---|---|---|---|
0 |
100 |
200 |
300 |
1 |
150 |
250 |
350 |
2 |
200 |
300 |
400 |
3 |
250 |
350 |
450 |
4 |
300 |
400 |
500 |
5 |
350 |
450 |
550 |
6 |
400 |
500 |
600 |
7 |
450 |
550 |
650 |
8 |
500 |
600 |
700 |
9 |
550 |
650 |
750 |
10 |
600 |
700 |
800 |
11 |
650 |
750 |
850 |
Product prices
Product 1 |
Product 2 |
Product 3 |
|---|---|---|
2 |
4 |
6 |
[1]:
import numpy as np
sales = np.array([[100, 200, 300], [150, 250, 350], [200, 300, 400], [250, 350, 450],
                  [300, 400, 500], [350, 450, 550], [400, 500, 600], [450, 550, 650],
                  [500, 600, 700], [550, 650, 750], [600, 700, 800], [650, 750, 850]])

prices = np.array([2, 4, 6])

revenues = np.zeros(sales.shape[1])
for j in range(sales.shape[1]):
    total = 0
    for i in range(sales.shape[0]):
        total += sales[i, j] * prices[j]
    revenues[j] = total
print(revenues)
[ 9000. 22800. 41400.]
The code snippet below attempts to filter a 2D numpy array to extract sales data greater than a given threshold value, and then compute the sales of products 2 and 3, but can be optimized for performance. Rewrite the code to improve its efficiency.
Sales matrix:
Month |
Product 1 |
Product 2 |
Product 3 |
|---|---|---|---|
0 |
100 |
200 |
300 |
1 |
150 |
250 |
350 |
2 |
200 |
300 |
400 |
3 |
250 |
350 |
450 |
4 |
300 |
400 |
500 |
5 |
350 |
450 |
550 |
6 |
400 |
500 |
600 |
7 |
450 |
550 |
650 |
8 |
500 |
600 |
700 |
9 |
550 |
650 |
750 |
10 |
600 |
700 |
800 |
11 |
650 |
750 |
850 |
Product prices | Product 1 | Product 2 | Product 3 | |———–|-----------|———–| | 2 | 4 | 6 |
import numpy as np
sales = np.array([[100, 200, 300], [150, 250, 350], [200, 300, 400], [250, 350, 450],
                  [300, 400, 500], [350, 450, 550], [400, 500, 600], [450, 550, 650],
                  [500, 600, 700], [550, 650, 750], [600, 700, 800], [650, 750, 850]])
threshold = 400
prices = np.array([2, 4, 6])
revenues = sales[:, 1][sales[:, 1] > threshold] * prices[1]
revenues += sales[:, 2][sales[:, 2] > threshold] * prices[2]
print(revenues)
[ ]: